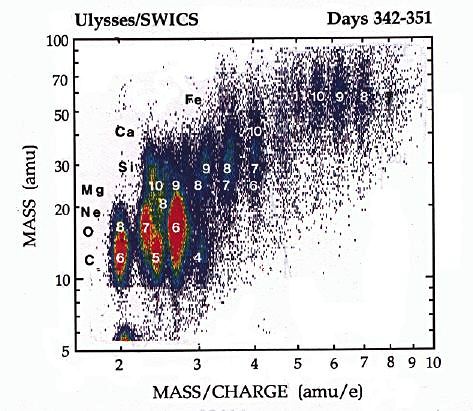
This graphic shows the mass vs mass per charge distributions of solar wind ions derived from the energy and time-of-flight pulse height data collected by Ulysses/SWICS during 8 - 17 December, 1990. Intensity is proportional to logarithmic counts. You can see well-resolved peaks for major solar heavy elements and their dominant charge states (e.g. C6+, C5+, O7+, Si9+, Fe10+). The relative abundances of the various charge states of elements that can be derived from data such as shown here may be used to infer electron temperatures in the solar corona.