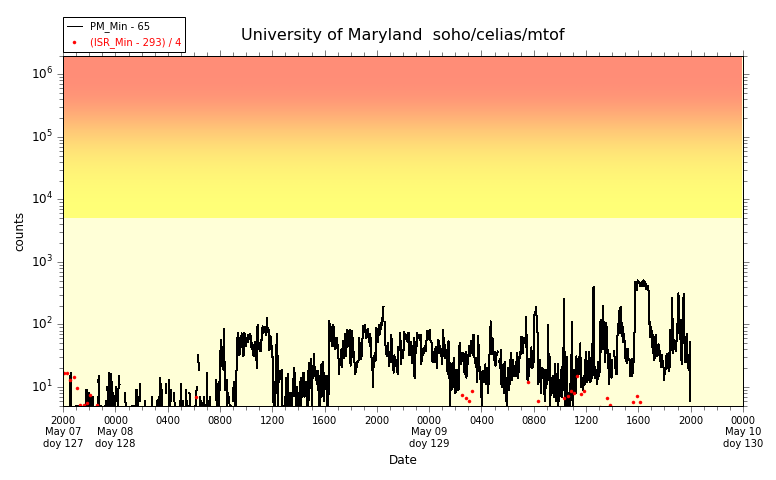
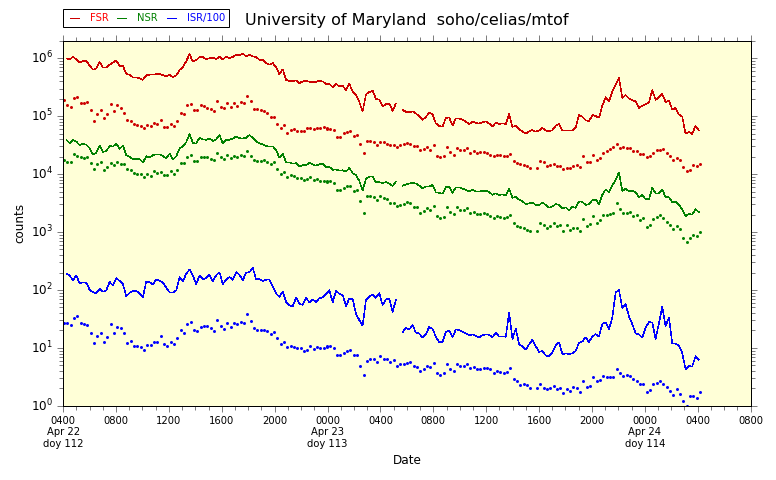
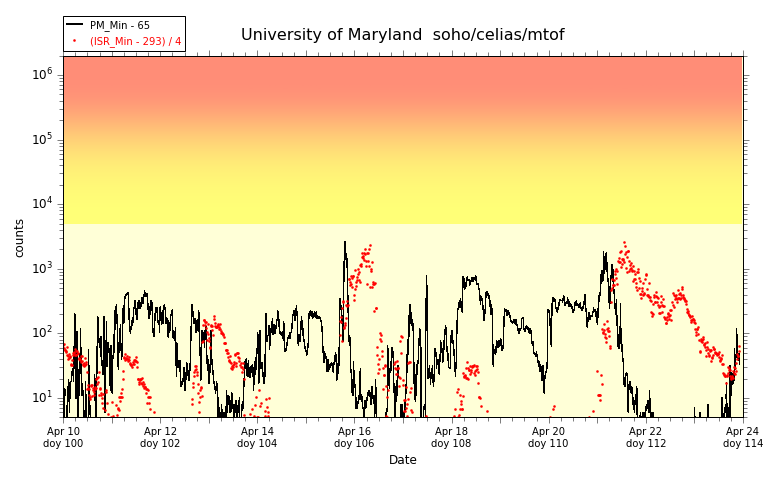
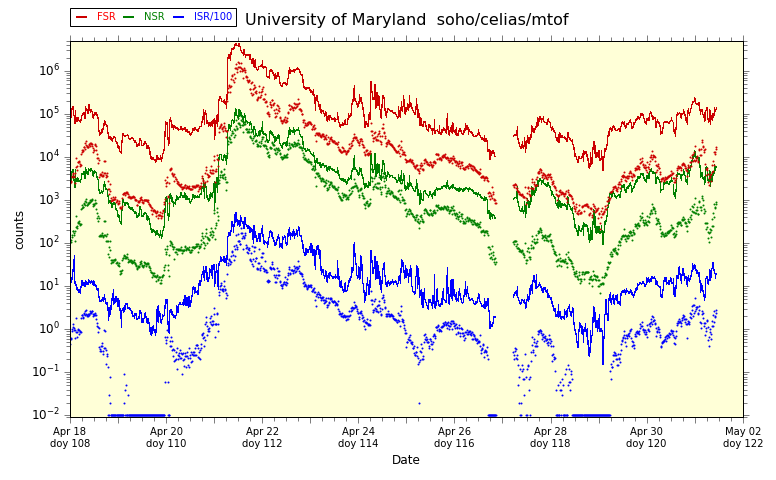
The Proton Monitor data consists of counting rates in a MicroChannel Plate (MCP) during six deflection system voltage steps corresponding to different solar wind Energy per Charge values. Generally, the solar wind produces a high counting rate in only 3 or 4 of the voltage steps. During a solar energetic particle event, secondaries produced by the energetic particles cause an elevated counting rate in all voltage steps. The plots below display the minimum of the six rates (with a constant value of 65 subtracted). The first plot covers 2 days using 2-minute averages, the second plot covers 2 weeks using 15-minute averages.
Very roughly, the PM MCP responds to secondaries generated by ions with incident energies > 40 MeV and electrons with incident energies < 2 MeV. Although exceptionally high density or temperature solar wind flows can produce high PM_Min rates, rate values above about 6000 generally indicate the presence of energetic flare particles. Under quiet solar wind conditions, flares can be identified at values below 100. Some of the largest particle flares since the PM was turned on in Jan 1996 were those of 14 July 2000, 8 Nov 2000, 4 Nov 2001, 28 Oct 2003, and 20 Jan 2005. All five had peak rates in the red zone (below). The 5 events are plotted together on a common time scale and with the time of shock passages indicated.
selected PM_Min plots during some interesting time periods


These are the background values subtracted from the various rates:
FSR - 355, NSR - 13, ISR - 293
the Proton Monitor home page CREDITS last update: 07/18/25 20:07