Cassini/MIMI/CHEMS Plots
On this website we offer two types of data:
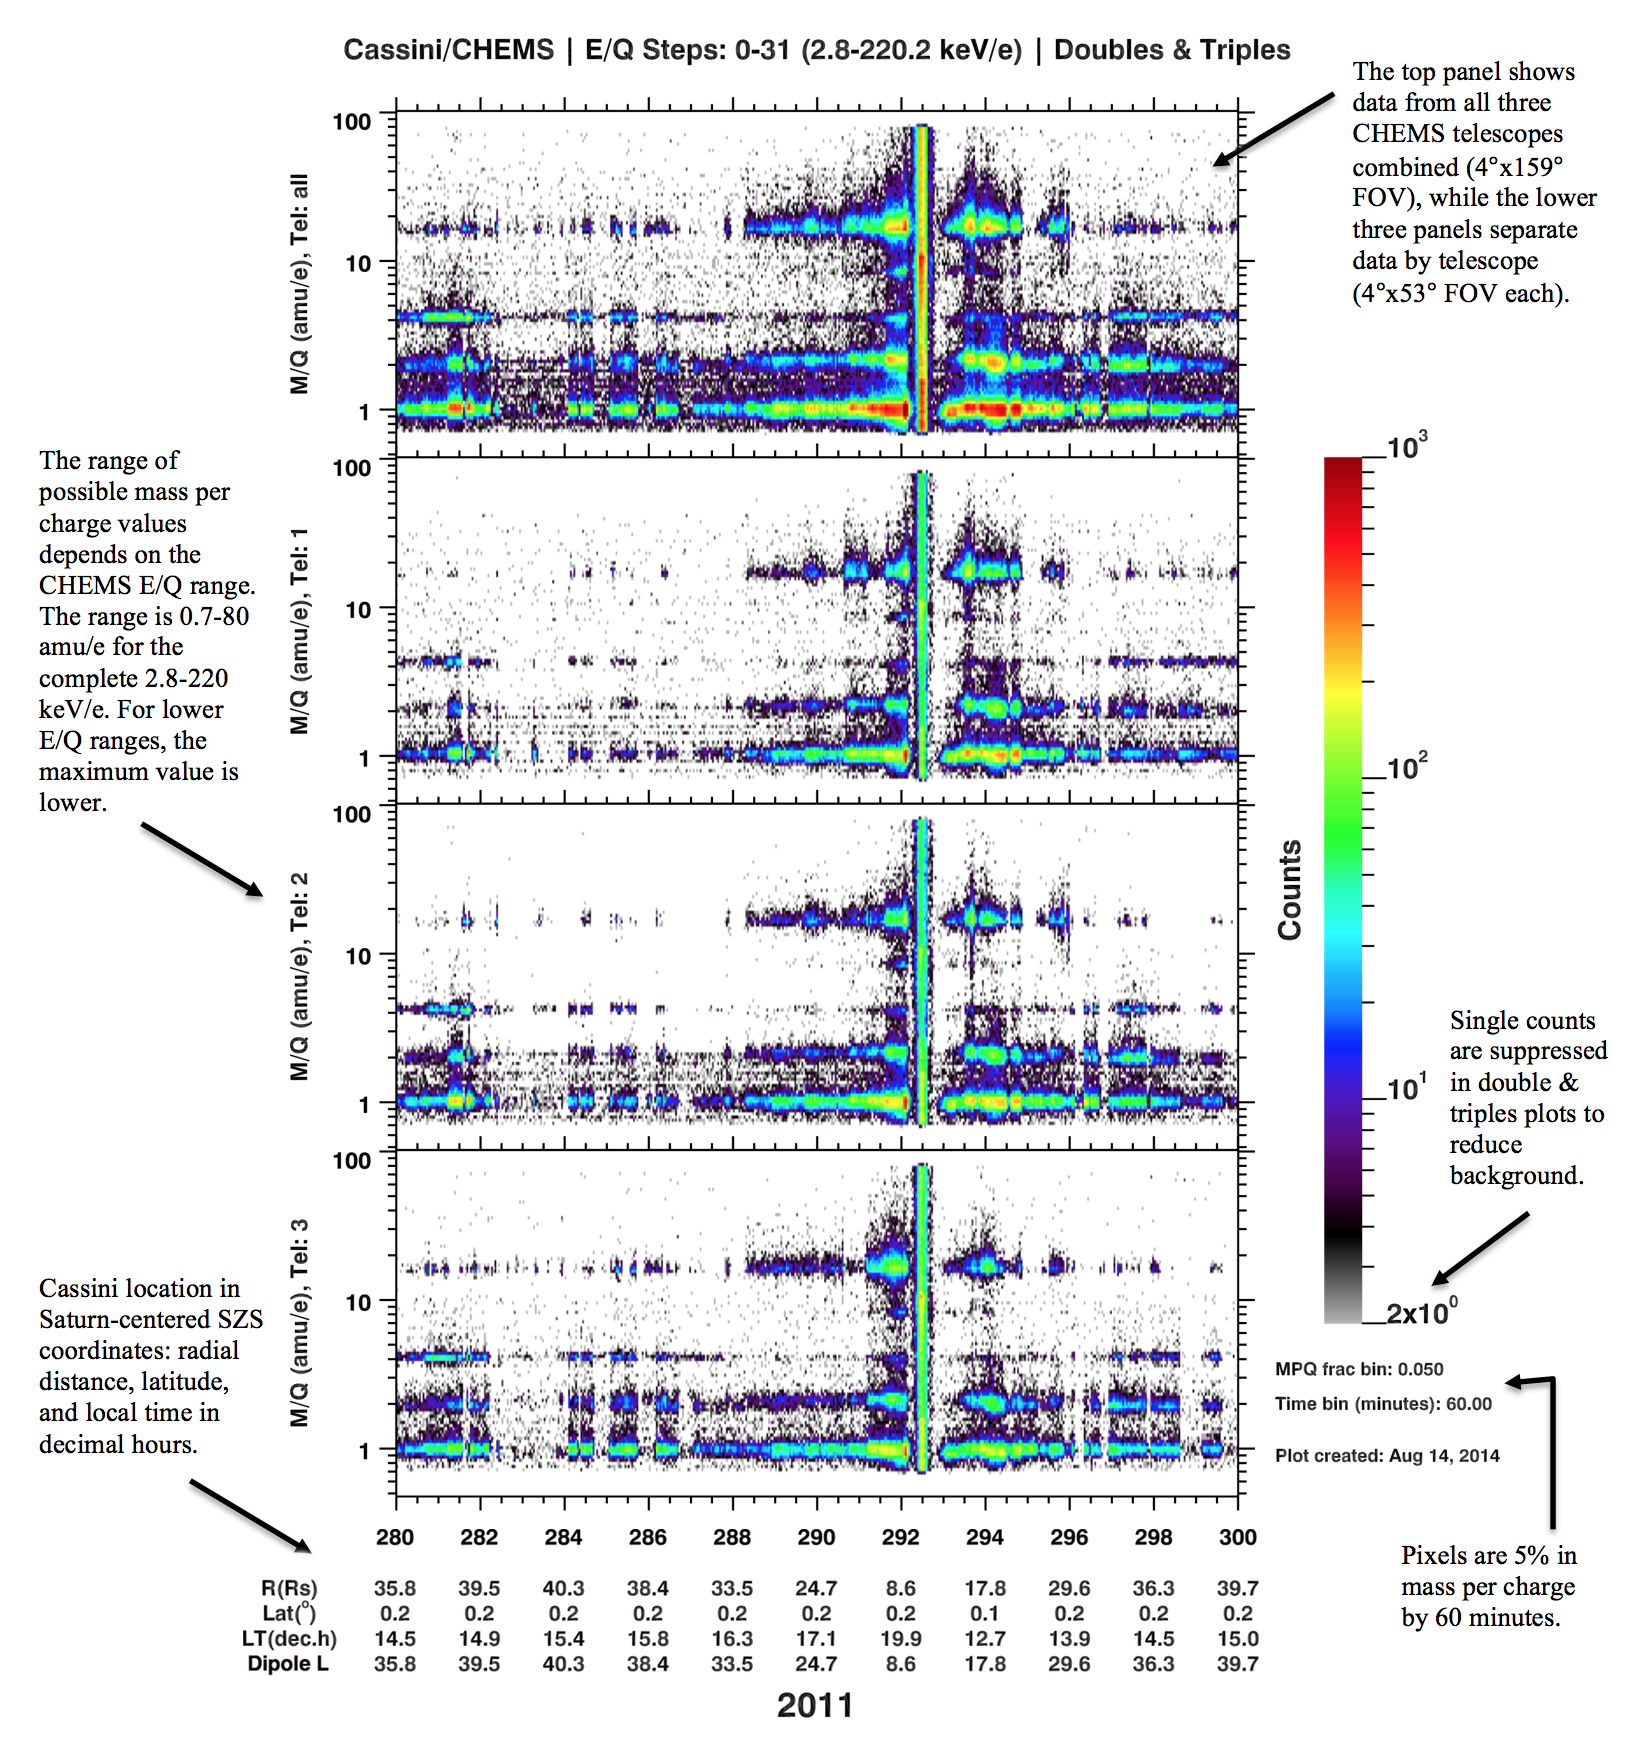
(1) 20-day plots of ion Mass per Charge versus time of detection (UT).
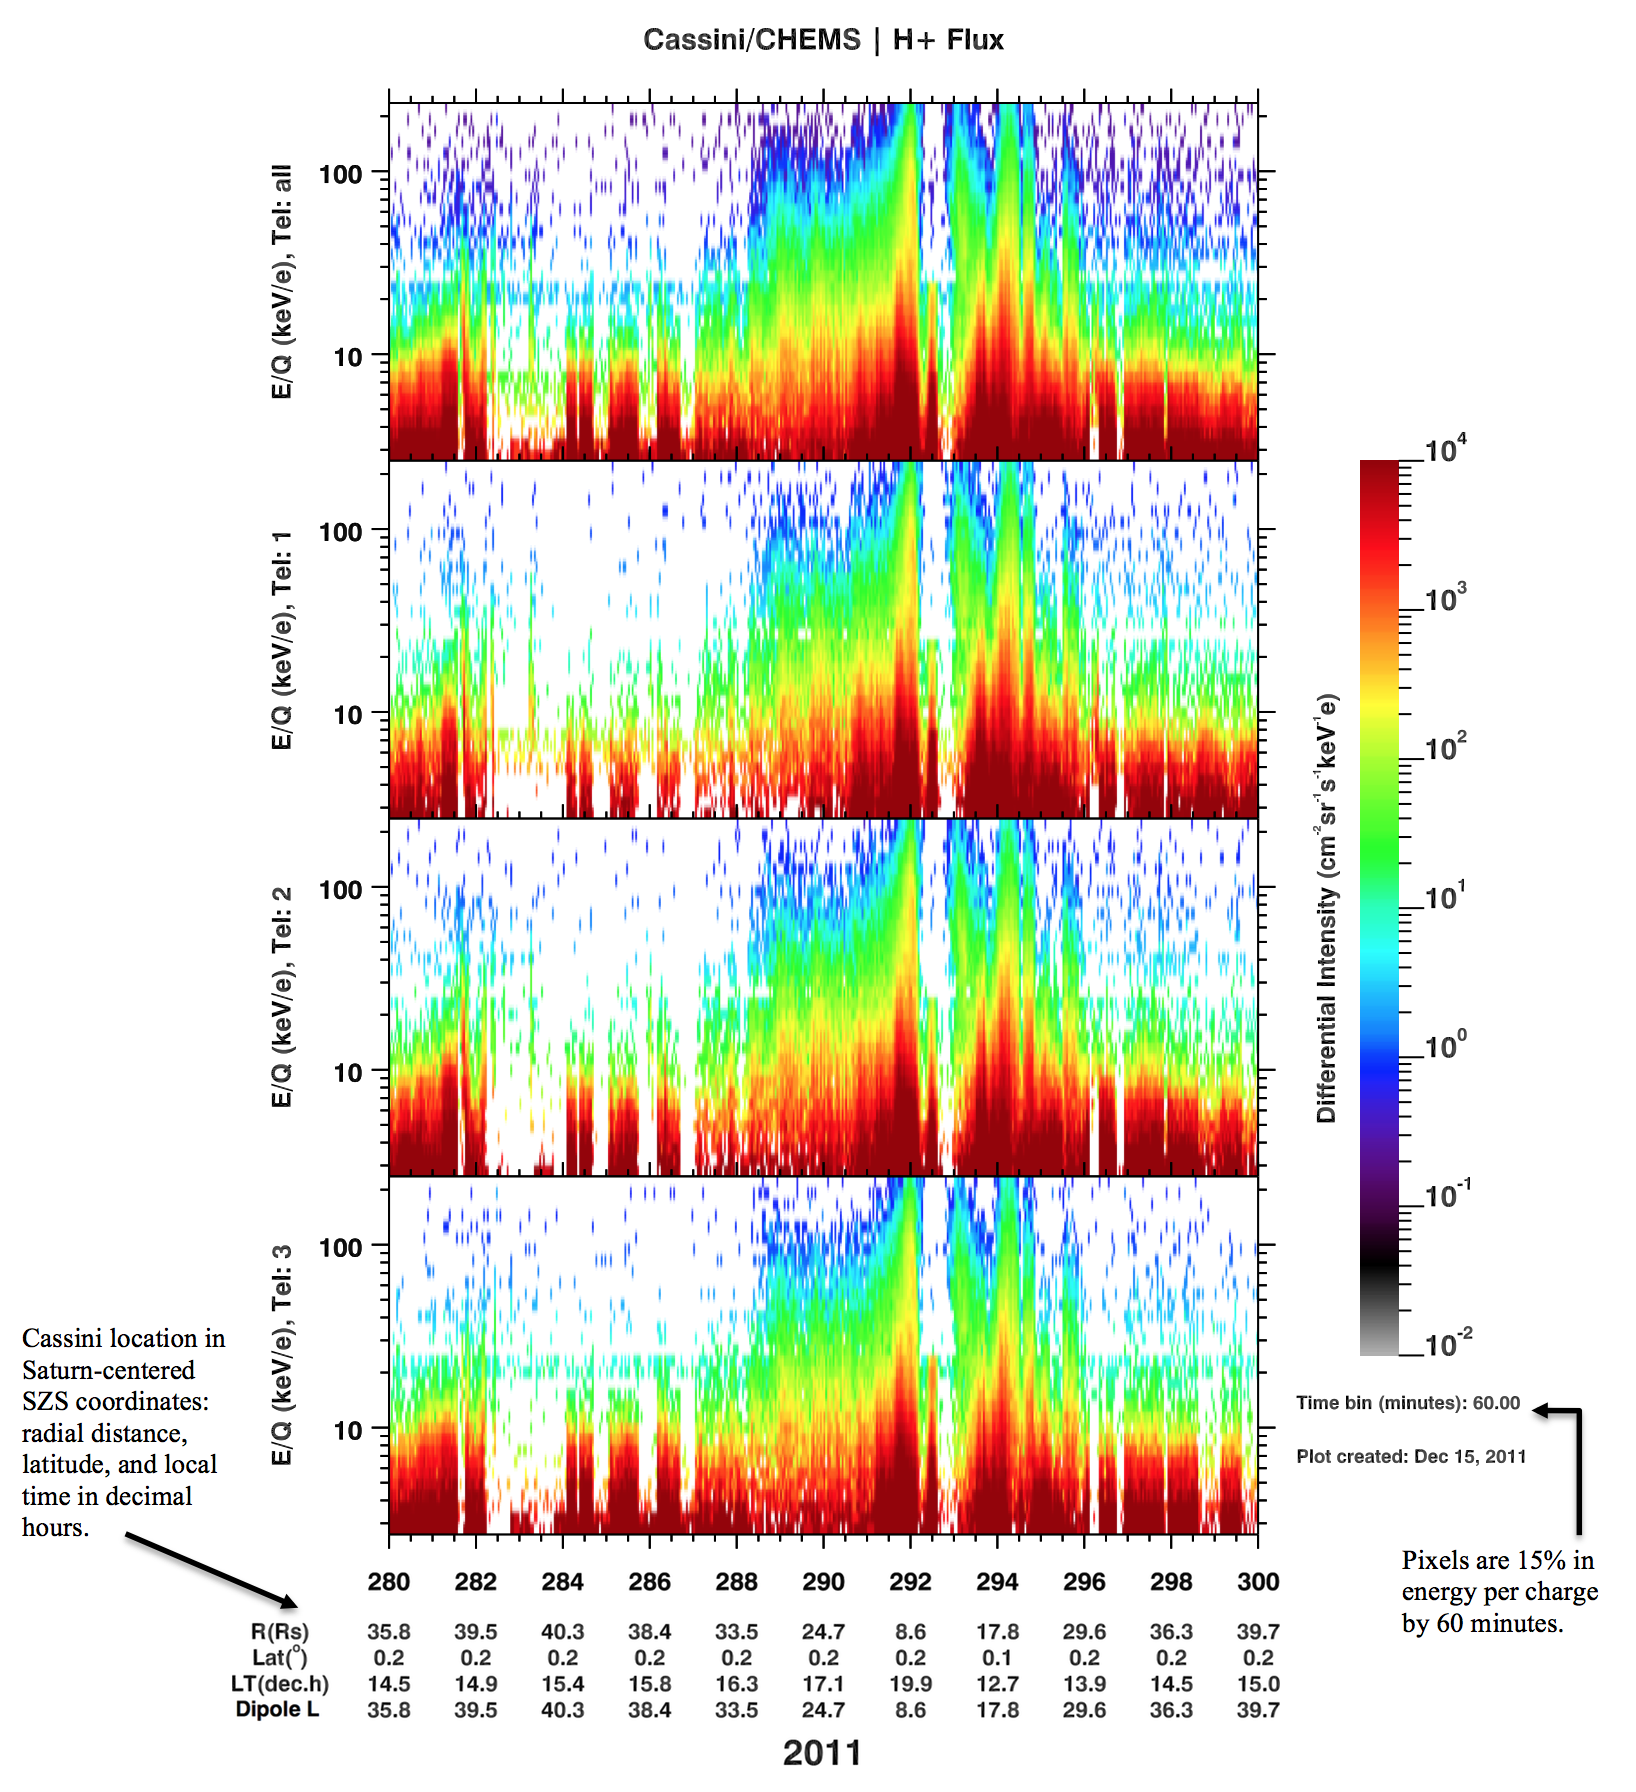
(2) 20-day energy per charge Spectrograms for six ion species (H+, He+, H2+, He++, O++, W+).
Both types of plots have one-hour resolution and are based on CHEMS PHA data. The water ion group
W+ includes O+, OH+, H2O+, and
H3O+.
Use the drop-down lists to choose a plot. Select the year, 20-day time period, and energy per charge step
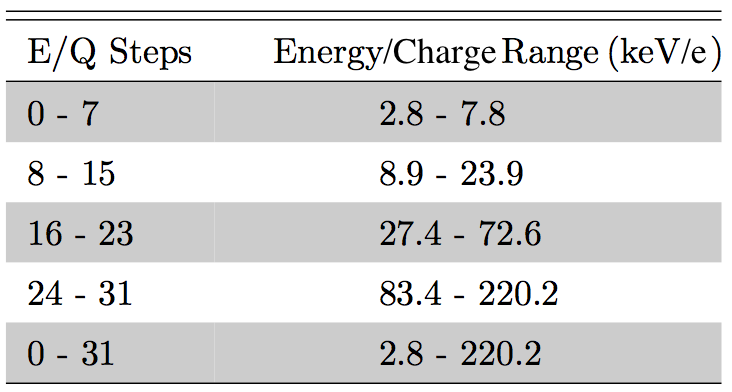
group (for M/Q plots) or ion species (Spectrograms). The E/Q step groups are:

In the Spectrogram section, you may also choose to get a .txt file including all flux values appearing in the spectrogram along with statistical uncertainties. That information is available for all three CHEMS telescopes combined (full 4° x 159° FOV) or by individual telescope (4° x 53° FOV) for years after 2003.
20-Day Mass per Charge Plots [PHA data]
Year
Days
E/Q Steps
for
Numerical Data from Mass per Charge Plots
Alternate interface to CHEMS 1 hour MpQ data
20-Day Energy per Charge Spectrograms by Ion Species [PHA data]
Year
Days
Species
for
Numerical Data from Spectrograms
Alternate interface to CHEMS 1 hour EpQ data
Sample Plots and Descriptions
Sample M/Q vs. Time Plot

Sample Spectrogram

†Not necessarily the most recent data.
Report technical problems to Doug Hamilton at dch@umd.edu